Your Clients Need You Even More... …Volatility Control Indices are Here to Stay!

Let's start with good news. Your clients and many life insurance carriers definitely need your expertise in selling and servicing Indexed Universal Life (IUL) products. And now, with the growing trend of volatility control (VC) indexed accounts, your value is more than solidified. The trade-off for your increased value is that more homework is required to understand and make the correct recommendations with these more complicated indices. Before going any further, one could argue that IUL producers should receive higher compensation in renewals and trail fees for the ongoing service necessary to manage the increased complexity.
But let's step back. Why isn't selling IULs with the S&P 500 index good enough? Even selling that account requires product knowledge and on-going service work to do right by clients. Are VC's a new invention and a great improvement overall? In order to answer those and a host of other questions we need to step back and see how we ended up where we are today.

If we look back to 2005 or so, then we'll recognize that it was the ideal time to sell IUL products. Interest rates were low but not as low as today. Volatility was low and insurance companies' general account portfolios were yielding strong results. It was the "perfect storm" scenario to sell IUL. In that economic environment, insurance carriers were able to offer higher caps/participation rates and the value proposition to clients was easy to explain and sell. "Can you live with fluctuating crediting interest rate returns that will never be lower than the guaranteed floor and up to the current cap rate?" Most clients said yes.
Of course, it didn't hurt that the maximum illustrated rates were also a lot higher than what current assumption UL products were able to illustrate. In this environment, IUL sales skyrocketed. You remember those days, right? There were many variations of IUL products with high cap rates and numerous look-back methodologies for maximum illustrated rates. Then came AG49.
AG49 went into effect on September 1, 2015 with a second phase implemented on March 1, 2016. That regulation defined the maximum illustrated rate (for policies with index-based interest) and did so on a consistent basis for all carriers. As a quick refresher, the illustrated rate was to be capped for all index allocation options at the lesser of:
- The average annual look-back rate for the S&P 500 Index, using the product's current annual cap, 0% floor, and 100% participating rate of all the possible 25-year periods from the most recent 65 calendar years.
- The insurance company's annual net investment earnings rate of the general account assets times 1.45 (which is the maximum assumed earned interest rate that can be used).
In addition to how maximum illustrated rates were to be calculated, AG49 instituted additional guidelines on policy loan leverage, additional side-by-side illustrations, and product disclosures to assist the consumer's understanding of the product.
You definitely remember what came next. While interest rates were slowly decreasing and volatility creeping into the picture, cap rates were being decreased. However, insurance companies started offering buy-up cap accounts and multipliers. The buy-up cap accounts increased the cap for a fee. Multiplier accounts were either guaranteed or not and varied in how the consumer paid for the feature. These features did not violate AG49 and sales continued to be strong, especially for carriers that implemented multipliers. Running an indexed loan income solve also leveraged the multiplier creating illustrations that, when run at the maximum rate, really started to get the attention of interested parties and regulators. Then came AG49-A.
AG49-A went into effect around November 25, 2020. AG49-A tightened the maximum illustrative rates by limiting the Benchmark Index Account (BIA) to just one account. Multipliers and buy-up cap accounts could no longer illustrate beyond the net illustrated rate of the BIA. Although multipliers and buy-up cap accounts can be offered, their benefit can't be illustrated above the net illustrated rate.
In addition to AG49-A, interest rates really started to come down, volatility was increasing and insurance companies were continuing to feel the squeeze of spread compression. Although low-interest rates can be pointed to as the main cause, the increase in volatility was not helping option prices and profitability for insurance companies. When you think of all the demand for S&P 500 options, including other financial instruments like indexed annuities, it's clear that the costs continued to cut into profit margins. In addition, AG49-A reduced the policy loan leverage to 50 basis points. Now what?

Introducing Volatility Control Indexed Accounts. No, these are not a new invention. Indexed annuities have been offering them for some time. The advantage to insurance companies is very straightforward. VC options cost less and are more stable and predictable. With the cost savings the insurance company may offer higher caps, uncapped accounts, higher participation rates, a fixed bonus, or maybe a combination of these. But with the AG49-A regulation in place how is it that many VC indexed accounts have higher maximum illustrated rates?
Many of these VC indices don't have the historical data available since the index is so new. The insurance company has to apply the VC index strategy to historical financial data when all components are available and apply it with the benefit in hindsight. The result is a hypothetical lookback rate. As long as the maximum rate isn't higher than the BIA or the 145% rule, that rate complies. Some life insurance companies use a BIA that isn't available to put premiums into and that's why you'll see some VC indices offering a higher maximum illustrated rate than the S&P 500 index account. Since VC maximum illustrated rates are hypothetical, it is doubly true that past performance is not a predictor of future performance.
The concept of volatility control indices is easy enough to understand. If volatility hits a level deemed too high by the rules of the index, then a greater percentage of the monies is transferred out of certain asset classes such as equities and commodities and into fixed options such as bonds. If the reverse happens and volatility is low, then the opposite takes place and more money is shifted into equities. However, the methodology and rules used by these VC indices are all different. How the sausage is made for each of these VC indices is complicated. Asset classes can range from one VC to another as well. Some offer international assets or alternative assets. So to answer another often asked question, "can I compare VC indices?" the clear answer is no. When you think of all the elements to VC indices (parameters, volatility trigger levels, and methodology used by the bank/investment company that created the index) it is impossible to compare them.

Are VC indices a great improvement? Depending upon the client's situation and risk tolerance these VC indices can be a good fit. For some clients having a more consistent crediting rate to their policy will allow them to sleep better at night. VC indices should return a segment's crediting rate in a more narrow range, not hitting either the cap or the floor, while an S&P indexed account will be at the cap or the floor more often. However, remember that these VC indices haven't been around that long so it is best not to think of these as "set and forget" strategies.
Looking at a recent segment might help here. If we look at March 2020 (see S&P 500 chart below), then you'll see we had high volatility and equities dropped. These VC indices would have moved the allocation over time to fixed options, but then over the next several months the market rebounded. The reallocation back to equities doesn't happen quickly and most clients would miss out on the early months of the upside. That scenario isn't a fit for all clients.

Can you look these up in the newspaper or on the internet? In some cases, yes, you can find the performance results of the VC index online. However, many can't be followed and you will need to rely on the insurance company to supply that data.
What about indices with fixed bonuses? With the savings on option costs we've seen adjustments to products with higher caps or uncapped accounts, higher participation rates, and fixed bonuses. These are benefits to the client's policy for sure. There are of course a couple of things to be aware of in particular with fixed bonuses. First, not all fixed bonuses are fully guaranteed. Also, when using an indexed loan and the VC index the fixed bonus is added to the leverage, so a 1% fixed bonus can be illustrating a loan leverage of 150 basis points – each and every year. This added leverage isn't technically against AG49-A, at least at this point. That kind of positive leverage isn't going to happen each and every year and clients should be made aware of that fact. It makes good sense to show a standard or fixed loan as well.
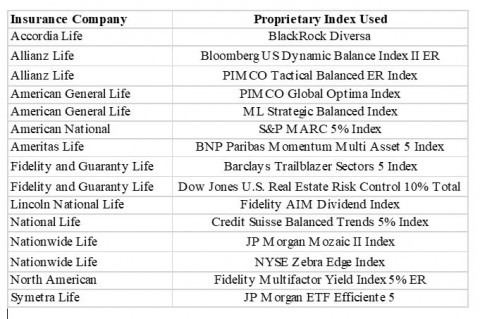
Here are some of the index accounts available today. No doubt more are on the way.
Are these VC indices the answer? Like so many life insurance questions the answer is "it depends." Remember that there are many non-guaranteed elements to VC indices and IUL products. Insurance companies have a lot of room to make adjustments. Depending upon the client's risk tolerance these accounts may be a fit. However, having a clear understanding of these accounts will be a must, as inevitably the client will want to know how the crediting rate is determined on his/her policy.

The development and launch of more complicated IUL products with volatility controlled indices has increased your value to your clients and prospects, because today there's more to analyze, understand, explain and service. But the fact is that IUL products are still general account products offered by insurance companies. And the yield on general account portfolios is typically in the 4% to 4.5% range. Although the math may work out that maximum illustrated rates can be higher, the yields in the engines behind these products aren't as high. For many IUL products with a VC index the illustration software defaults to the account with the maximum illustrated rate. Your real value to clients will be explaining why planning on a lower crediting rate is the prudent thing to do.
Someone once said that the only defense we really have to mitigate risk is diversification. Splitting premiums into other indexed accounts along with a VC index may work for many clients. And, as always, it is both professional and prudent to run illustrations at lower assumed rates of return. The only conclusion that can be drawn with certainty from an IUL illustration is that the client's future policy values will not be the same as the numbers on the page. The maximum illustrated rate will not happen each and every year, and clients and insurance companies are relying on you to set realistic expectations. So take advantage of this unique opportunity: Distinguish yourself and your practice by becoming an invaluable resource to help your client understand what is really happening "behind the curtain" of IUL.
Jeff Driscoll is Vice-President, Product & Carrier Management, for Partners Financial. Jeff works with NFP centers on supporting producers' efforts to locate, synthesize, and market life insurance that best match customer needs by researching and analyzing a wide range of life insurance products. As a current member of the PartnersFinancial product team, Jeff's focus on up-to-the-minute interactions with carrier partners to share feedback among firms allows him to provide the latest in product opportunities. Jeff is a primary contributor to the PartnersFinancial Weekly Product Update, read by all producers and case designers, which includes product insights, trends, and the latest product news.
Prior to joining NFP, Jeff managed John Hancock's highly regarded Competitive Services Group, which successfully supported their life insurance distribution channels. His leadership built and sustained an effective team of product analysts and researchers, whose findings were key factors in the product development process. Prior to that, Jeff was a John Hancock agent, providing him key insights into challenges faced by the sales force. He started his career in sales and marketing in the computer industry in both the retail and distribution channels. Jeff holds both CLU and ChFC designations and FINRA Series 7 and 24 licenses. He is a member of the Boston Chapter of the Society of Financial Services Professionals and is a graduate of Boston College's Carroll School of Management.
Jeff has an exceptional understanding of the life insurance product marketplace and a broad network of contacts throughout the industry. His collegial style and depth of experience has earned him respect by all stakeholders as well as advisers of all backgrounds, especially those in the high net worth market segment.
Comments